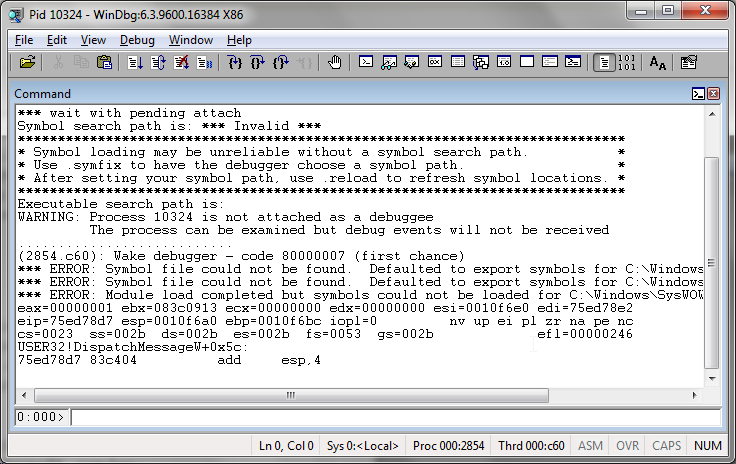
Windbg to the rescue!
Today I had to track down a performance issue on a live site where the CPU usage was abnormally high. I couldn't reproduce it locally, and didn't want to install profiling tools on the live server (not that our IT team would have allowed this anyway!).
I tried the standard checklist - checking database calls in SQL Server Profiler, examining IIS web logs to see if there were clues in the URLs that were being hit, etc, etc. No clues. I had a quick look at JetBrain's dotTrace which supports remote profiling, however this didn't work due to limitations in the .NET Profiler API on versions prior to .NET 4.
That left Windbg. It's been a while since I've used it, so I had to refresh my memory with some of its strange commands.
This blog post isn't specifically about the issue I tracked down today - but rather a 'how to' on using Windbg to track down a performance issue in .NET.
Incidentally, the issue I tracked down today turned out to be due to someone's debug code (not mine!) that had accidentally been checked in. This was flushing one of our caches on every request - causing a large XML file to be parsed for each request. An easy mistake to make - but with quite dramatic consequences. Luckily Windbg helped me track it down!
I thought it would be useful to write this blog post as a reference on how to debug using WinDbg.
Digging out Windbg somehow feels like a last resort that will take an afternoon just to remind yourself how to use it. However, once you know a few key commands, then that isn't the case and it can be extremely useful and quite a quick turnaround too. Hopefully this blog post will help both 'future me' and anyone else reading this quickly diagnose their problem.
Creating a process dump
Whilst you can attach Windbg directly to a running process, I prefer to use SysInternal's procdump tool to generate a dump file so that it's then disconnected from the running process, and I can query and run commands on it to my heart's content.
To do this, you can use the following command:
procdump -ma
In my case, this was the process id of the w3wp worker process for the application pool that our site used.
The -ma argument tells it to dump all of the processes memory.
There are various other arguments which allow you to tweak how the tool works. For example, whilst the example above will generate the dump immediately, you can instead add conditions - eg. create the dump when an exception is thrown, or create the dump as soon as memory usage goes over a specified value, etc.
Getting WinDbg
The advantage of using Windbg, is that you don't need to install it. You can copy the files to the remote server, and run it directly. I keep a local copy (both the 32bit and 64bit versions) on my development machine, ready to copy over to a server when required.
It is packaged as part of both the WDK or Windows SDK, as described here.
Using WinDbg
The windbg interface is basic, consisting mostly of an output window and a command bar at the bottom.

The first thing we need to do is load the dump file that we generated the procdump tool. For this, you can either press ctrl-d or choose Open Crash Dump... from the File menu.
Once loaded, you can now proceed to query information about the state of the process from when the dump file was generated.
But first, as we're dealing with managed code, we'll need to load the SOS module (sos.dll) that will have been included as part of your Windbg install. You can load this with the following command:
.load sos
Now that this is loaded, you will now have access to additional commands for managed code. The full list is here, but I've included the ones I found most useful today below for reference:
Useful commands
| !threads | Lists all managed threads |
| !EEStack -EE | Displays the callstack for all threads. The -EE option causes only managed functions to be displayed in the callstacks |
| !clrstack | Displays a callstack of managed code only for the current thread |
| !runaway | Display information about time consumed by each thread. Very useful for quickly seeing which thread is causing the issue! |
| ~#s | Switch thread - where '#' is the thread id |
How do I track down a performance issue with the above commands?
The !runaway command mentioned above is very useful. In my case, there were many threads running, but two stood out in that they had been running for longer than the rest.
Narrowing down on those threads by switching to them using ~46s (one of the two threads happened to be id 46 if you hadn't guessed!), then running !clrstack showed me that the code was parsing an XML file which should have been cached. Likewise with thread 47.
I also found that the !EEStack -EE command happened to also show me the issue as it dumps out the managed callstacks from all thread, and as most of the threads weren't managed, I was given quite a clear picture. Also very useful command to have in your toolbelt.
Summary
From time to time we are going to hit an issue on a production server that we can't reproduce locally. It doesn't happen often, and tends to happen infrequently enough to mean that you practically have to relearn even the basic commands for unintuitive tools like Windbg. Hopefully this post will save both myself and any readers some time in the future.
Happy debugging! ...
Comments