Output logging with DebugView
Whilst debuggers have become more and more powerful over the years, simple debug output traces certainly still have their place in many situations. Logging out information at certain points in your code can tell you a lot about what's going on, especially when trying to debug an issue.
The Visual Studio output window is very useful, but also rather limited. For example, you can't filter the output. It also requires the debugger to be attached to the process in question at the time.
Enter DebugView (part of the Sysinternals Suite). This is a standalone program that monitors debug output from any running processes on your computer.
DebugView is an application that lets you monitor debug output on your local system, or any computer on the network that you can reach via TCP/IP. It is capable of displaying both kernel-mode and Win32 debug output, so you don't need a debugger to catch the debug output your applications or device drivers generate, nor do you need to modify your applications or drivers to use non-standard debug output APIs.
Filters
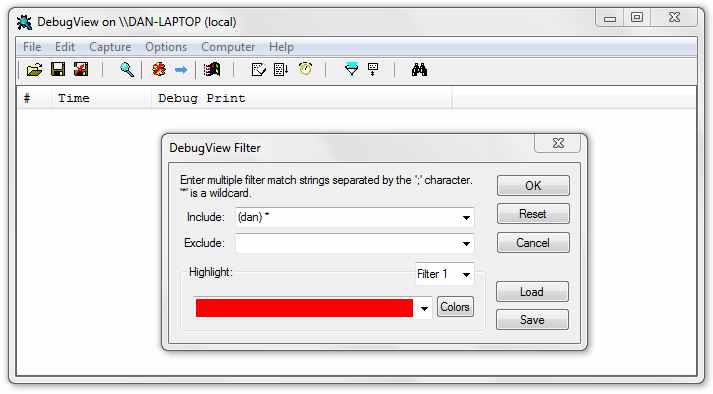
As mentioned earlier, the Visual Studio output window doesn't support filter. However, in DebugView you can enter patterns to include or exclude. For example, I quite often prefix temporary output logs with my name in brackets. That way, I can use the following filter to only show my temporary logs:

Enabling DbgPrint() in Registry
By default global debug output is disabled in Vista/Server2008 and above, which means that you might not see your debug information in DebugView. Luckily, this is just a registry setting. To enable it, add the following registry key and set its default value to "0xFFFFFFFF".
[HKEY_LOCAL_MACHINE\SYSTEM\CurrentControlSet\Control\Session Manager\Debug Print Filter]
To save time, I've created a downloadable registry file which you can use to quickly add this entry: DebugViewFix.reg
Note that a reboot is required after this change.
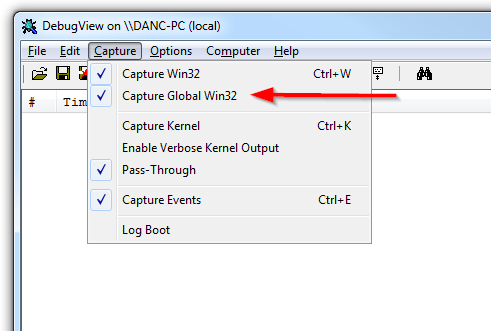
After making this change, make sure that you've selected the 'Capture Global Win32' option from the Capture menu:

Comments